
AXA IM’s Equity Factor Dashboard
- 12 March 2025 (5 min read)
KEY POINTS
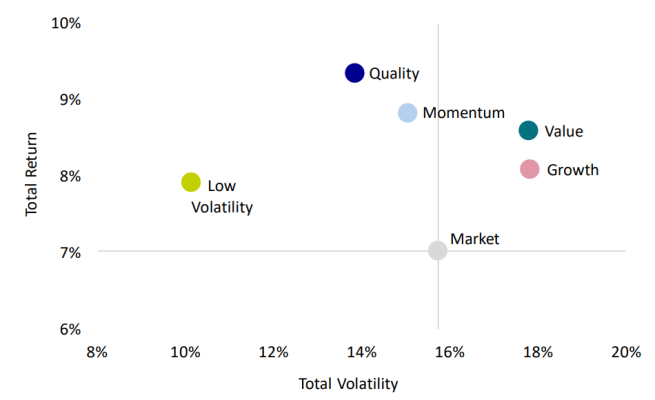
Equity investors often use certain styles, or ‘factors’ to build portfolios. Factor-driven investment is most often used by quantitative equity managers and while numerous factors exist, they can generally be grouped into the so-called ‘famous five’, namely Value, Quality, Growth, Momentum and Low volatility. In their simplest form these factors can be defined as:
- Value: Companies with a stock price which is relatively inexpensive compared to fundamentals, such as price-to-earnings, price-to-book value and dividend.
- Quality: Companies which have attractive levels of profitability (such as return on equity). Quality measures can also incorporate balance sheet information and measure the stability of earnings delivery.
- Growth: Companies with high historical and/or expected levels of future sales or earnings growth, typically measured over a multi-year horizon.
- Momentum: Companies which have had a positive price change relative to the market, typically measured over the previous 12 months. Momentum factors can also incorporate changes in earnings expectations.
- Low volatility: Companies with stock prices that are relatively less sensitive to market moves, i.e., their stock beta, and/or idiosyncratic risk is lower than the market.
Why are Equity factors important?
The reason these factors are significant is because over the long term – and while past performance is not a guide to future returns – each has delivered a premium return to the overall equity market, albeit with differing levels of risk.
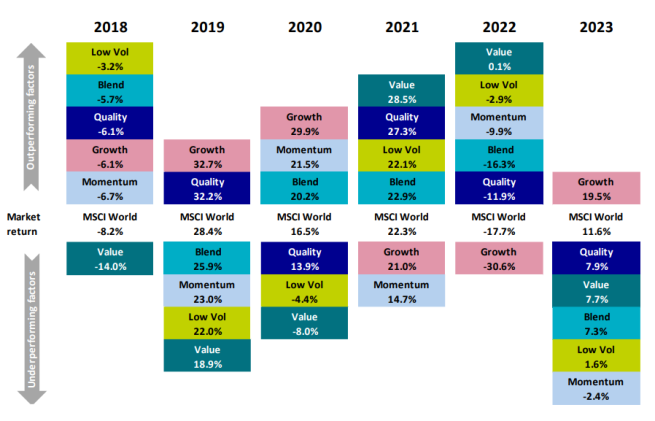
Factor investing does, of course, have its share of challenges; for example, over short-term horizons individual factors can suffer from periods of weak performance. Fortunately, however, it is rare that all factors are out of favour at the same time, so when one factor is weak it’s likely that others will be performing well. Because of this, factor investing practitioners will often combine factors to achieve a better near-term investment outcome (see Exhibit 2).
AXA IM Equity Factor Dashboard
At AXA IM, we believe in a blended approach to factor investing and implementing factor approaches with a long-term view.
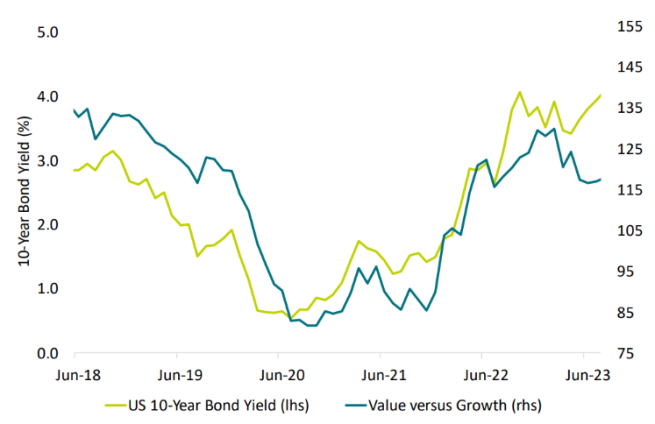
However, we also believe there is information that can help us better understand the likely behavior of individual factors over the short term. We know for example that different factors respond differently to changing interest rate regimes. This was starkly illustrated in 2022 when tightening monetary policy drove a rotation away from Growth to Value stocks. More recently, as the market consensus sees central banks reaching peak interest rates, Growth has recovered some ground.
In addition to monetary policy, there are other indicators which we believe can offer insights into the likely near-term performance of factors. These include macroeconomic conditions, factor valuations, as well as technical indicators, such as volatility and factor crowding, i.e., when a particular factor is very popular and overbought.
Our Equity Factor Dashboard is designed to bring together all the insights we have on the drivers of factor performance into one place. The Dashboard provides us with rankings which offer a quantitatively-driven view on the expected near-term performance of the famous five factors given current market conditions.
AXA IM’s Equity Factor Dashboard methodology
Below, we explain how the Dashboard works. There are three steps to generating a scorecard:
Step 1: Measure historical factor response to different indicators: We assess historical factor performance against a range of macroeconomic and market indicators to determine if an indicator has been a guide to performance in the following six months. The analysis covers a period between 1995 and 2022 and all the major factor families of Quality, Growth, Value, Momentum, and Low Volatility.
For some factors the assessment can be performed at a sub-factor level, for example Value is split into price-to-earnings, price-to-book and dividend yield, while Growth is split into trailing and forecast sales growth.
The indicators used in the scorecard are:
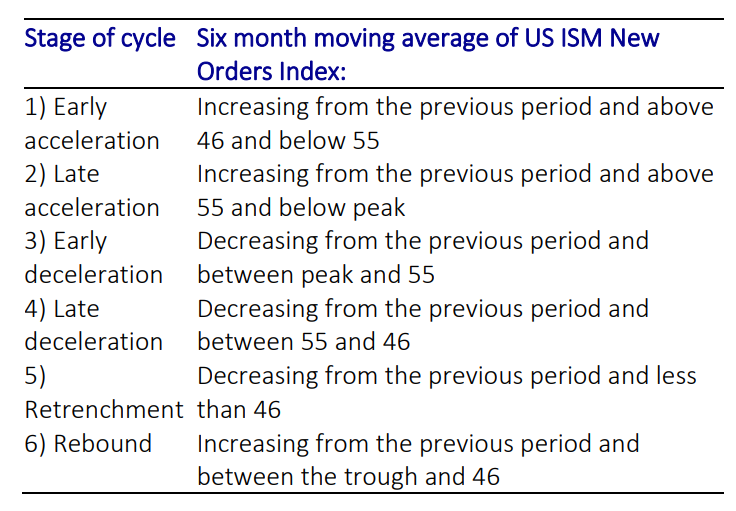
- Macro: We measure the performance of each factor based on the stage of the macroeconomic cycle. We split the economic cycle into six stages based on the level and direction of the US Institute for Supply Management (ISM) New Orders Index, considered to be a key indicator of the state of the US economy.
In addition to the stage of the economic cycle, we also measure each factor’s subsequent performance regarding market-implied volatility (VIX) level.
- Interest rates: We measure each factor’s responsiveness (or beta) to change in 10-year and two-year U.S. bond yields. By looking at both we can capture market information on interest rate direction as well as the changing slope of the yield curve on both 10 and two-year bonds.
- Valuation: We assess if factor valuation help explain subsequent performance outcomes. We measure factor valuations based on trailing price-to-book and price-to-earning and forecast price-to earnings. We examine future performance outcomes with respect to absolute valuation and relative to each factor’s historical average.
- Technical: We assess the following technical indicators and assess if they help explain subsequent performance outcomes: (i) Factor crowding, which measures the dispersion of returns of stocks within a given factor – a low variability of return indicates the factor is crowded, i.e., potentially overbought; (ii) Short-term factor volatility; (iii) Factor correlation. We then measure if each technical metric helps explain subsequent performance.
Step 2: Assign factor scores based on current conditions: We measure current conditions for the indicators outlined above and then assign a score to every factor based how important that indicator has been in explaining subsequent performance outcomes historically (i.e., the assessment made in Step 1). A positive score is allocated if the indicator points to future outperformance, while a negative score is apportioned if the indicator points to underperformance. A higher or lower score is allocated in cases when the analysis in Step 1 indicates a higher conviction in expected outcomes.
All scores assigned are based on an objective quantitative assessment of past performance outcomes. This means some factors do not receive a score if the indicator has not been relevant for future outcomes. Our research revealed a number of cases which were contradictory to commonly-held investment views, for example when Quality is expensive, it has not historically been a negative for Quality outcomes over the following six months.
Step 3: Rank overall factor scores: The final step is to sum up each factor (or sub-factor) score across all the indicators (Macro, Interest Rates, Valuation and Technical) to arrive a final score for each factor given current conditions. The factor with the highest score is the one expected to perform the best over the near term (the next six months) while the factor with lowest score is expected to have weakest near-term performance. Below we show two examples of our Equity Factor Dashboard for May 2019 and March 2022.
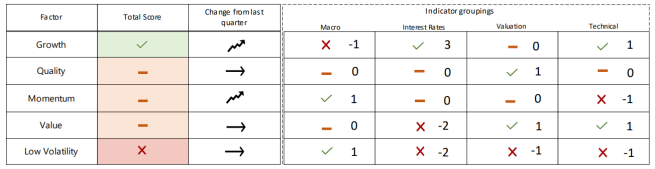
In May 2019, forward interest rates expectations were falling and we were in the early deceleration phase of the macro cycle. At this time, Growth was the best scoring factor on the dashboard, driven by positive interest rate and technicals.
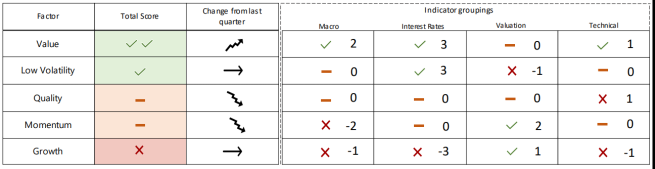
In March 2022, central banks’ tightening was underway and forward interest rates were pricing in further tightening. At this time, Value was the best-ranked factor on the dashboard, supported by positive interest rate, macro, and technical scores.
Equity Factor Dashboard: Backtest
Because our scorecard is entirely quantitatively driven, we can backtest historical factor rankings based on prevailing macroeconomic and market indicators. The direction of interest rates in the backtest is based on market forward interest rate expectations.
In Exhibit 5 above, we compare the results of a hypothetical blended factor portfolio with static weights (i.e., one with an equal weighting in Quality, Growth, Value, Momentum, and Low volatility) – to a dynamic weighted factor portfolio, where each factor’s weighting is based on historical ranking according to our scorecard.
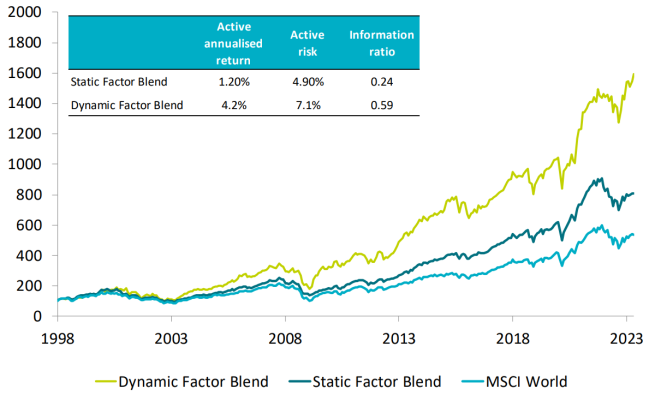
Over the period of the backtest the dynamic factor has higher levels of active return than a static factor blend. The dynamic blend however comes with a higher level of active risk, though the active return to active risk ratio (the information ratio) is superior.
While our backtesting yields positive results and is designed to emphasise out-of-sample robustness, we must recognise the inherent constraints. For instance, our choice of indicators, like the ISM framework as an economic cycle indicator, is justified by its established historical predictive power. However, it's worth considering whether such relationships would have been as apparent or utilized in the same way during earlier periods, such as the late 1990s.
Factor investment through the cycle
Over the long term historically, the equity factors of Value, Quality, Growth, Momentum and Low volatility have offered investors a return premium to that of the overall market. However individual factors can be out of favour for periods of time and as such blending more than one factor together makes investment sense.
As equity factor investors, we also know that factor performance is impacted by macro and micro influences. Our Equity Factor Dashboard brings together our factor performance research insights and provides a quantitatively-driven view on the expected near-term performance of the famous five factors given current market conditions.


Disclaimer
Risk Warning
Investment involves risk including the loss of capital.
The information has been established on the basis of data, projections, forecasts, anticipations and hypothesis which are subjective. This analysis and conclusions are the expression of an opinion, based on available data at a specific date. Due to the subjective aspect of these analyses, the effective evolution of the economic variables and values of the financial markets could be significantly different for the projections, forecast, anticipations and hypothesis which are communicated in this material.
Disclaimer
This document is being provided for informational purposes only. The information contained herein is confidential and is intended solely for the person to which it has been delivered. It may not be reproduced or transmitted, in whole or in part, by any means, to third parties without the prior consent of the AXA Investment Managers US, Inc. (the “Adviser”). This communication does not constitute on the part of AXA Investment Managers a solicitation or investment, legal or tax advice. Due to its simplification, this document is partial and opinions, estimates and forecasts herein are subjective and subject to change without notice. There is no guarantee forecasts made will come to pass. Data, figures, declarations, analysis, predictions and other information in this document is provided based on our state of knowledge at the time of creation of this document. Whilst every care is taken, no representation or warranty (including liability towards third parties), express or implied, is made as to the accuracy, reliability or completeness of the information contained herein. Reliance upon information in this material is at the sole discretion of the recipient. This material does not contain sufficient information to support an investment decision.
© 2025 AXA Investment Managers. All rights reserved